What the image shows
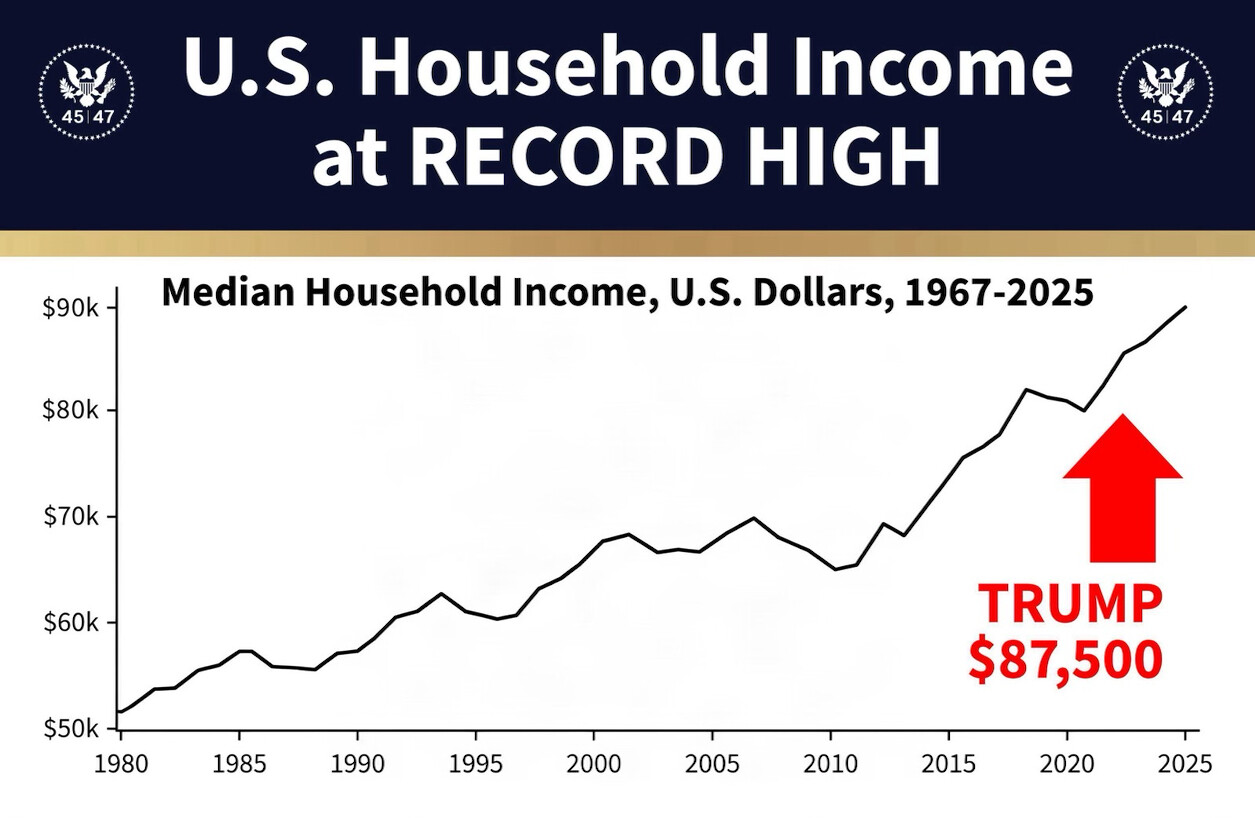
A political infographic with a dark navy header reading "U.S. Household Income at RECORD HIGH," flanked by two circular presidential-seal-style eagle emblems each labeled "45 | 47." Below is a line chart titled "Median Household Income, U.S. Dollars, 1967-2025" (though the x-axis shown runs from 1980 to 2025), plotting a generally upward trend from about $52k in 1980 to about $90k by 2025, with dips around 1990-1991, 2001, and 2008-2009/2020. A red upward-pointing arrow highlights the rightmost portion of the line near 2025, next to red text reading "TRUMP $87,500."
Text in image: U.S. Household Income at RECORD HIGH 45 | 47 (x2, in seal emblems) Median Household Income, U.S. Dollars, 1967-2025 $90k $80k $70k $60k $50k 1980 1985 1990 1995 2000 2005 2010 2015 2020 2025 TRUMP $87,500
Described automatically. The words above are a machine's reading of the picture, not Trump's.