What the image shows
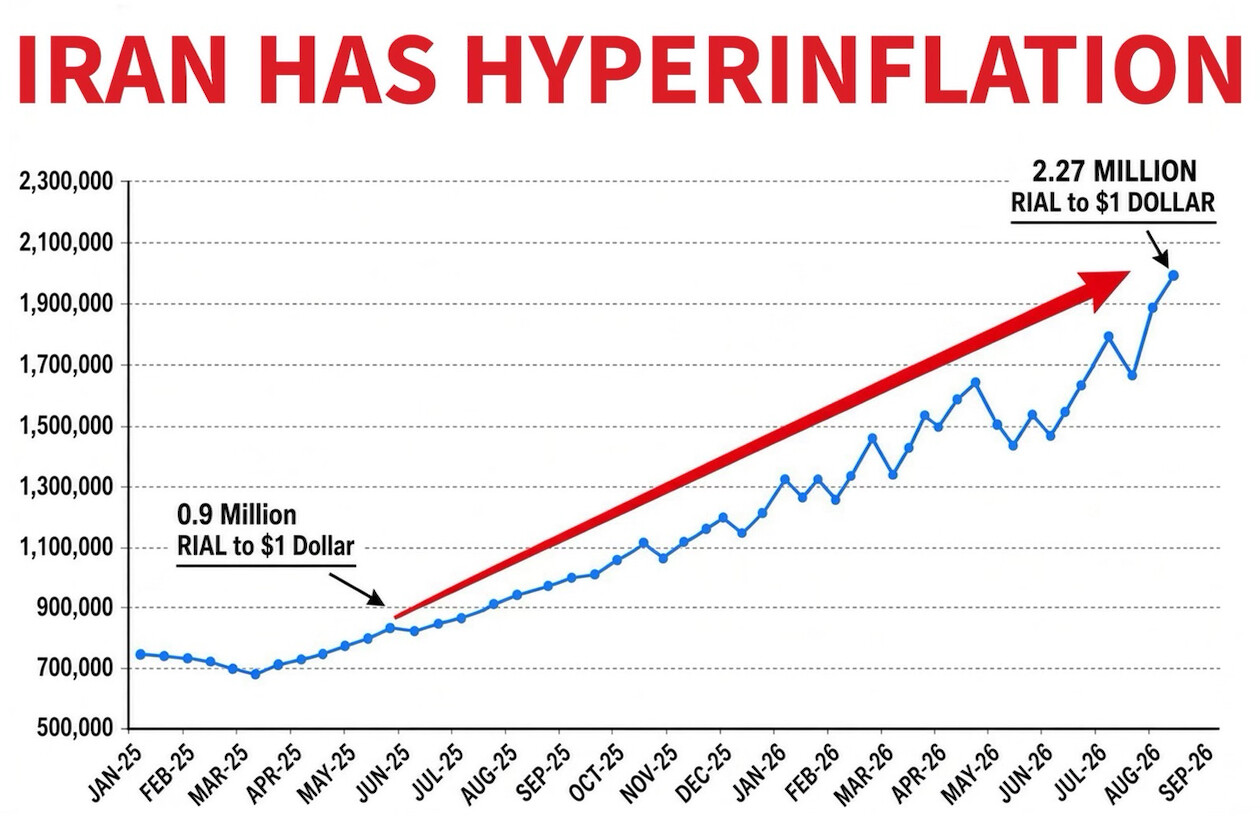
A chart image with a bold red headline reading "IRAN HAS HYPERINFLATION" above a line graph plotting the Iranian rial-to-US-dollar exchange rate from Jan-25 through Sep-26. The blue line trends steadily upward with fluctuations, starting around 720,000-900,000 rial per dollar and climbing to roughly 1.95-2.27 million rial per dollar by late 2026. A thick red arrow overlays the chart pointing from a callout labeled "0.9 Million RIAL to $1 Dollar" (near Jun-25) up to a callout labeled "2.27 MILLION RIAL to $1 DOLLAR" near the end of the timeline (around Aug/Sep-26), emphasizing the currency's depreciation. The y-axis ranges from 500,000 to 2,300,000 in increments of 200,000.
Text in image: IRAN HAS HYPERINFLATION 0.9 Million RIAL to $1 Dollar 2.27 MILLION RIAL to $1 DOLLAR 2,300,000 2,100,000 1,900,000 1,700,000 1,500,000 1,300,000 1,100,000 900,000 700,000 500,000 JAN-25 FEB-25 MAR-25 APR-25 MAY-25 JUN-25 JUL-25 AUG-25 SEP-25 OCT-25 NOV-25 DEC-25 JAN-26 FEB-26 MAR-26 APR-26 MAY-26 JUN-26 JUL-26 AUG-26 SEP-26
Described automatically. The words above are a machine's reading of the picture, not Trump's.