What the image shows
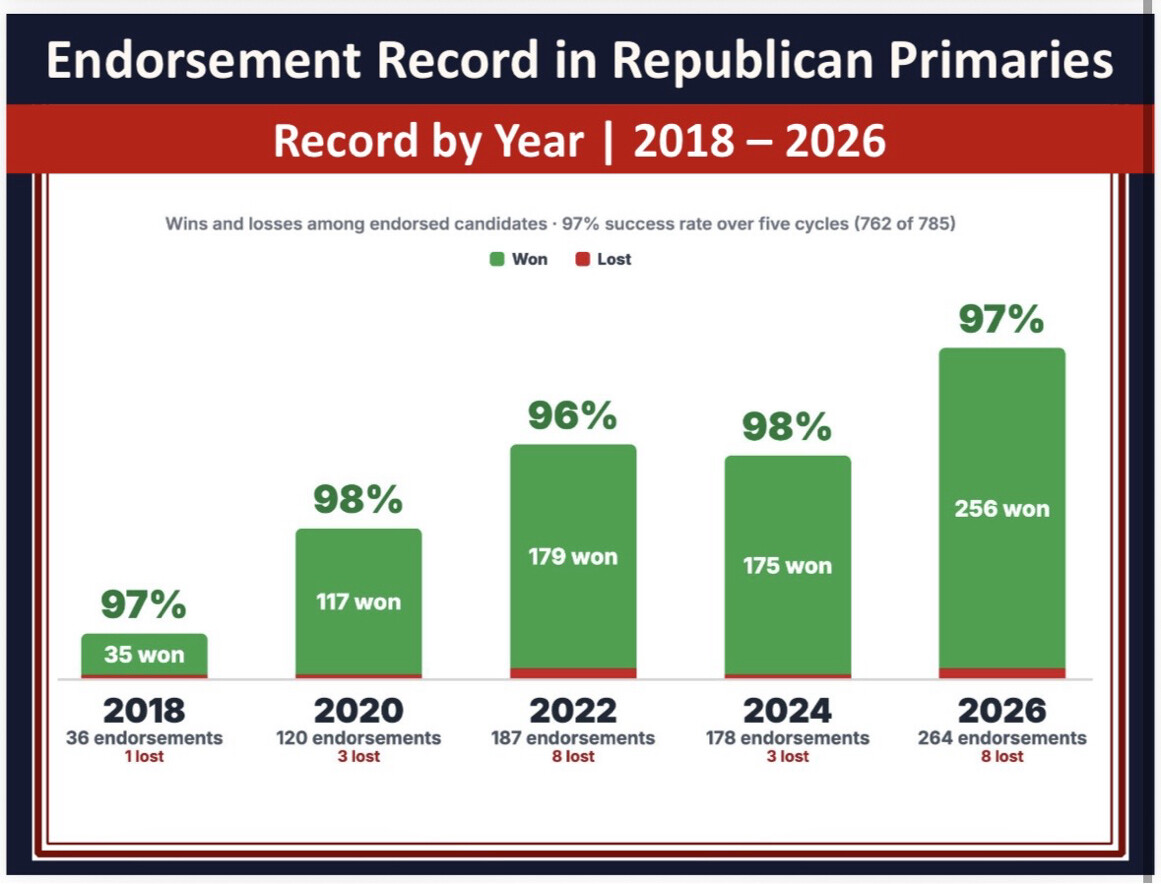
A chart/infographic titled "Endorsement Record in Republican Primaries" with subtitle "Record by Year | 2018-2026". It is a bar chart showing wins (green) and losses (red, shown as small segments at the base of each bar) for endorsed candidates across five election cycles: 2018, 2020, 2022, 2024, and 2026. Each bar is labeled with a win percentage above it and a "won" count inside the bar, with endorsement totals and losses listed below each year on the x-axis.
Text in image: Endorsement Record in Republican Primaries. Record by Year 2018-2026. Wins and losses among endorsed candidates. 97 percent success rate over five cycles (762 of 785). Won. Lost. 97 percent, 35 won, 2018, 36 endorsements, 1 lost. 98 percent, 117 won, 2020, 120 endorsements, 3 lost. 96 percent, 179 won, 2022, 187 endorsements, 8 lost. 98 percent, 175 won, 2024, 178 endorsements, 3 lost. 97 percent, 256 won, 2026, 264 endorsements, 8 lost.
Described automatically. The words above are a machine's reading of the picture, not Trump's.