What the image shows
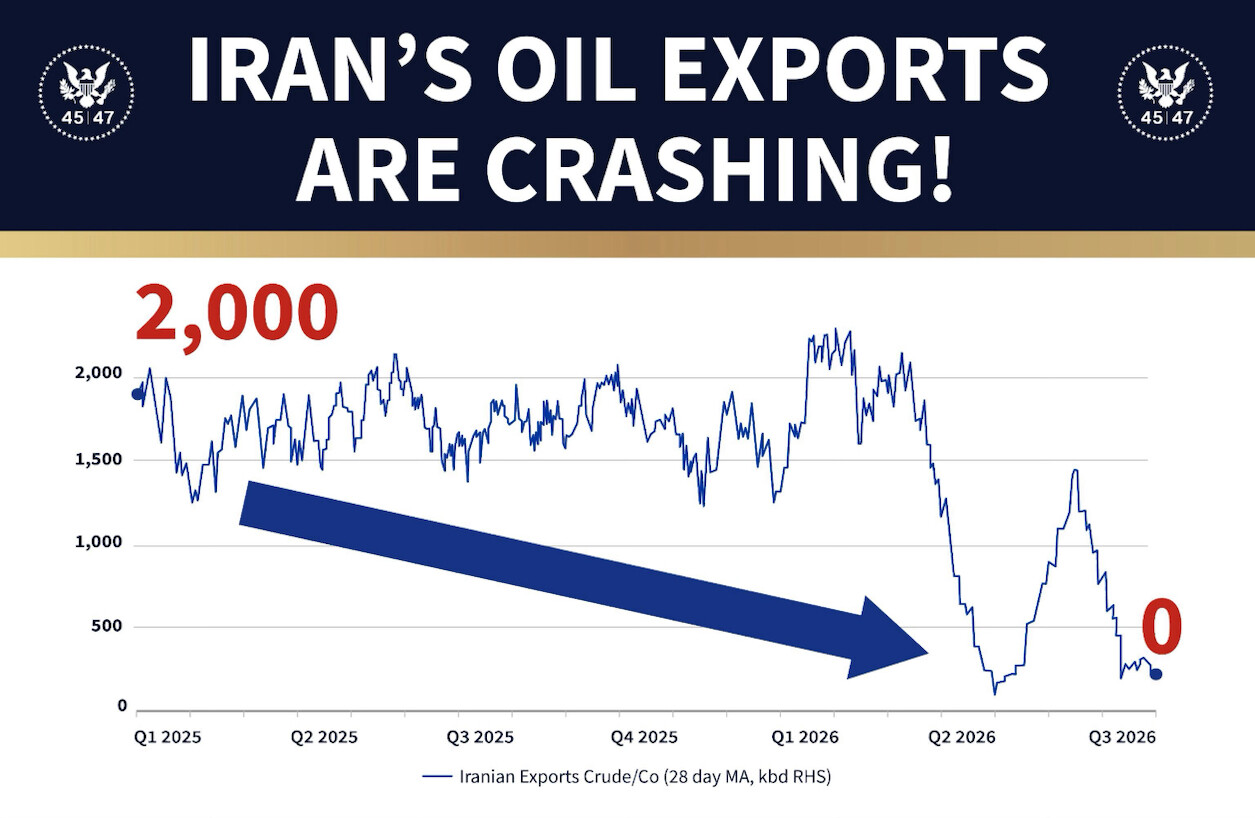
A political/promotional graphic with a dark navy header reading "IRAN'S OIL EXPORTS ARE CRASHING!" flanked by two circular presidential-style seals each labeled "45|47" (referencing Trump as the 45th and 47th US president). Below the header is a line chart titled by its legend "Iranian Exports Crude/Co (28 day MA, kbd RHS)," plotting a value on the y-axis (0 to 2,000+) against quarters from Q1 2025 through Q3 2026 on the x-axis. The line fluctuates between roughly 1,300 and 2,100 through late 2025/early 2026, then drops sharply toward zero by Q2-Q3 2026. A large dark blue downward-pointing arrow is overlaid on the chart emphasizing the decline. Red numeric labels "2,000" near the start of the line and "0" near its end highlight the starting and ending values.
Text in image: IRAN'S OIL EXPORTS ARE CRASHING! 45|47 45|47 2,000 2,000 1,500 1,000 500 0 Q1 2025 Q2 2025 Q3 2025 Q4 2025 Q1 2026 Q2 2026 Q3 2026 0 Iranian Exports Crude/Co (28 day MA, kbd RHS)
Described automatically. The words above are a machine's reading of the picture, not Trump's.