What the image shows
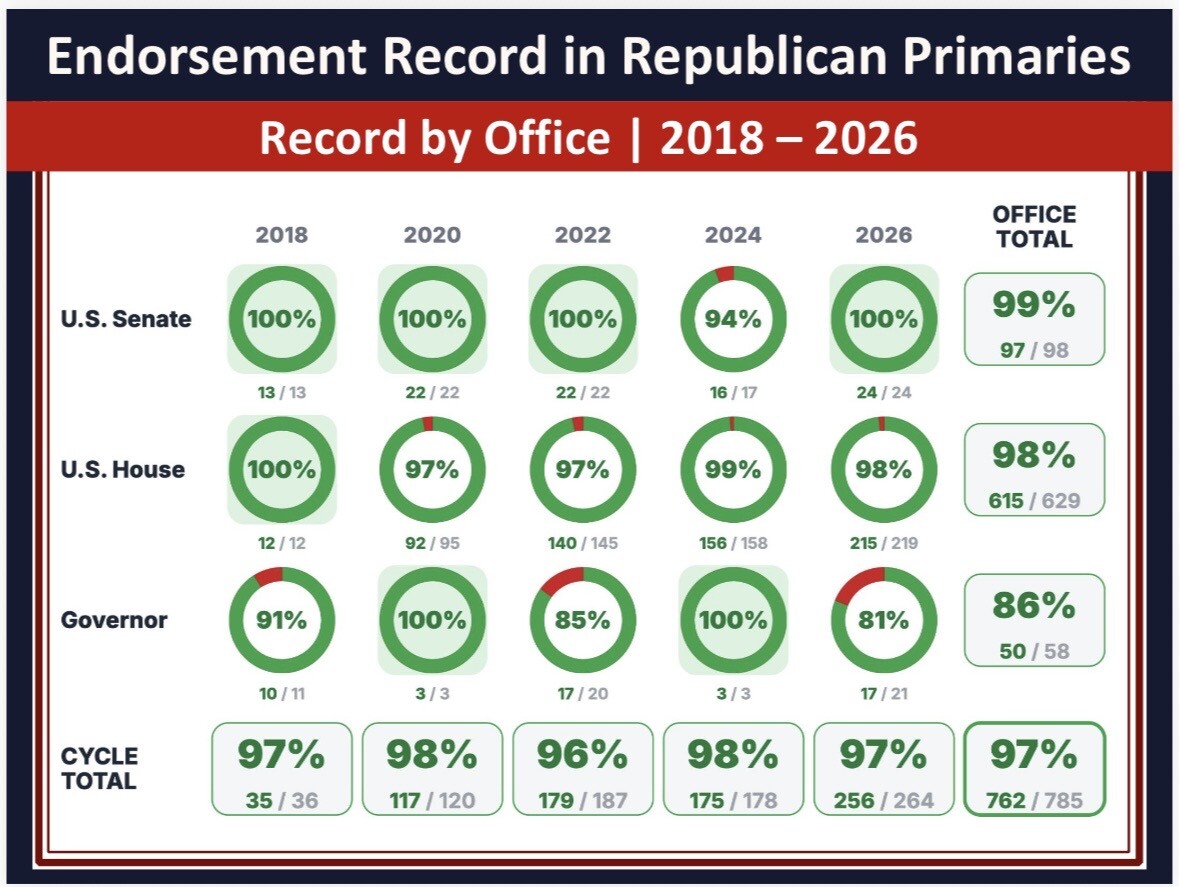
An infographic chart titled "Endorsement Record in Republican Primaries," subtitled "Record by Office | 2018 – 2026." It presents a grid of green-and-red circular donut-percentage charts broken down by office (U.S. Senate, U.S. House, Governor) across election cycles (2018, 2020, 2022, 2024, 2026), each showing a win percentage and a fraction (wins over total endorsements). An "Office Total" column on the right gives overall percentages and fractions per office, and a "Cycle Total" row at the bottom gives overall percentages and fractions per year, with a grand total of 97% (762/785) in the bottom right corner.
Text in image: Endorsement Record in Republican Primaries Record by Office | 2018 – 2026 2018 2020 2022 2024 2026 OFFICE TOTAL U.S. Senate 100% 100% 100% 94% 100% 99% 13/13 22/22 22/22 16/17 24/24 97/98 U.S. House 100% 97% 97% 99% 98% 98% 12/12 92/95 140/145 156/158 215/219 615/629 Governor 91% 100% 85% 100% 81% 86% 10/11 3/3 17/20 3/3 17/21 50/58 CYCLE TOTAL 97% 98% 96% 98% 97% 97% 35/36 117/120 179/187 175/178 256/264 762/785
Described automatically. The words above are a machine's reading of the picture, not Trump's.