What the image shows
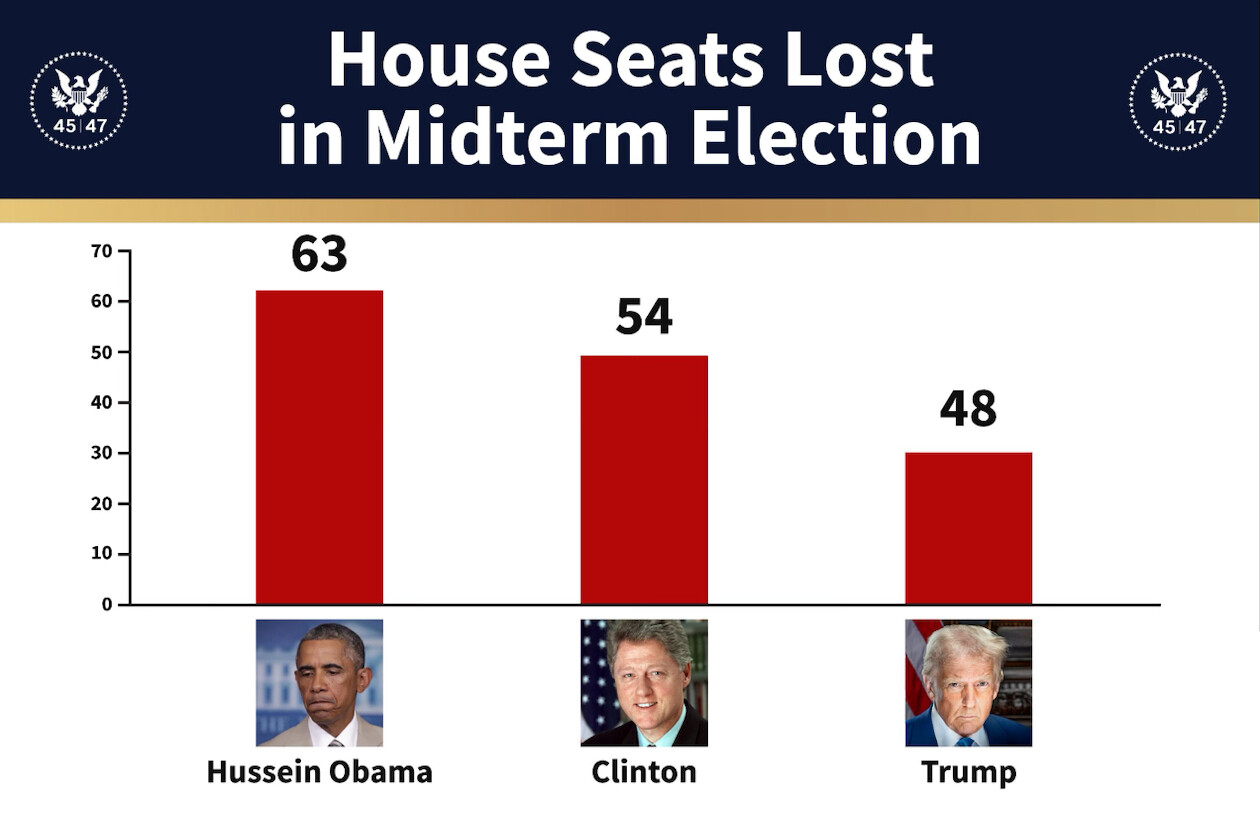
A bar chart graphic with a dark navy header banner bearing a gold stripe beneath it and a circular eagle seal marked "45|47" at each end. Three red vertical bars on a white background compare House seats lost in midterm elections: the first is labeled 63 under a photo of Barack Obama (a man with a downcast, frowning expression, in a tan suit), the second 54 under a photo of Bill Clinton (smiling, dark suit, flag behind him), the third 48 under a photo of Donald Trump (stern expression, dark suit, flag behind him). The y-axis runs 0 to 70 in steps of 10. The bar heights do not match the printed numbers: the 63 bar reaches about 62 on the axis, the 54 bar about 49, and the 48 bar only about 30. The graphic asserts that Trump lost fewer House seats in a midterm than Obama or Clinton, and it uses "Hussein" as Obama's first name.
Text in image: House Seats Lost in Midterm Election 45|47 45|47 70 60 50 40 30 20 10 0 63 54 48 Hussein Obama Clinton Trump
Described automatically. The words above are a machine's reading of the picture, not Trump's.