Search Posts

Platform:
Date range:
to

4 results for "tag:infographic-share"

Post from Truth Social

Image attachment
What the image shows chart

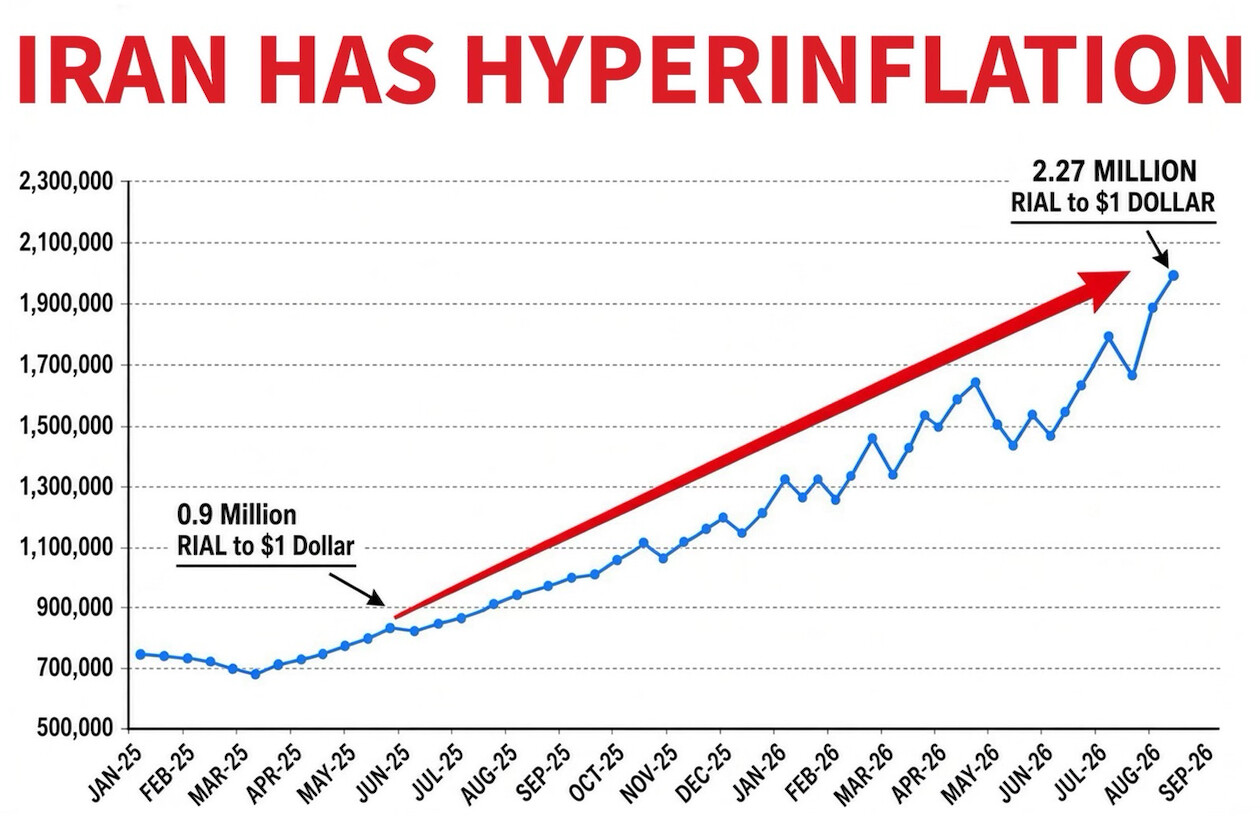
A chart image with a bold red headline reading "IRAN HAS HYPERINFLATION" above a line graph plotting the Iranian rial-to-US-dollar exchange rate from Jan-25 through Sep-26. The blue line trends steadily upward with fluctuations, starting around 720,000-900,000 rial per dollar and climbing to roughly 1.95-2.27 million rial per dollar by late 2026. A thick red arrow overlays the chart pointing from a callout labeled "0.9 Million RIAL to $1 Dollar" (near Jun-25) up to a callout labeled "2.27 MILLION RIAL to $1 DOLLAR" near the end of the timeline (around Aug/Sep-26), emphasizing the currency's depreciation. The y-axis ranges from 500,000 to 2,300,000 in increments of 200,000.

Text in image: IRAN HAS HYPERINFLATION 0.9 Million RIAL to $1 Dollar 2.27 MILLION RIAL to $1 DOLLAR 2,300,000 2,100,000 1,900,000 1,700,000 1,500,000 1,300,000 1,100,000 900,000 700,000 500,000 JAN-25 FEB-25 MAR-25 APR-25 MAY-25 JUN-25 JUL-25 AUG-25 SEP-25 OCT-25 NOV-25 DEC-25 JAN-26 FEB-26 MAR-26 APR-26 MAY-26 JUN-26 JUL-26 AUG-26 SEP-26

Described automatically. The words above are a machine's reading of the picture, not Trump's.
Post from Truth Social

Image attachment
What the image shows chart

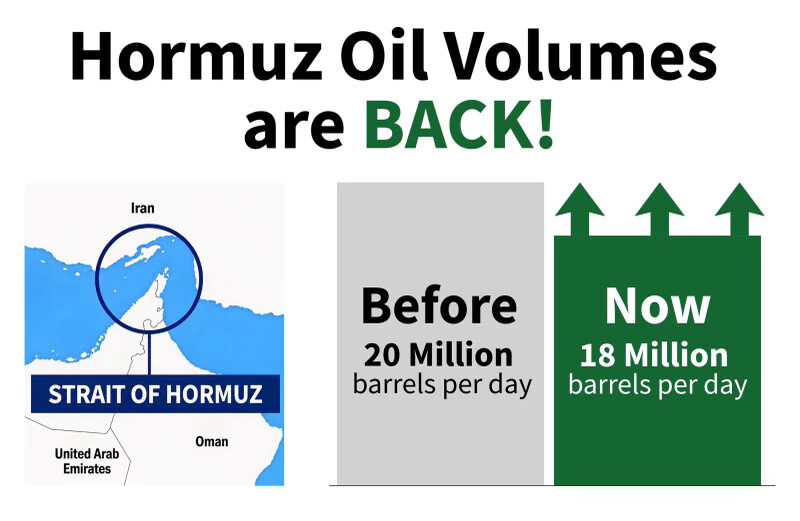
An infographic-style chart. On the left is a map showing the Strait of Hormuz, circled, located between Iran and the Arabian Peninsula (labeled Iran, United Arab Emirates, Oman), with the strait highlighted in a blue banner. On the right is a bar comparison graphic: a gray bar labeled "Before / 20 Million barrels per day" next to a green bar labeled "Now / 18 Million barrels per day" with upward arrows above the green bar. The headline at top reads "Hormuz Oil Volumes are BACK!" despite the chart showing the "Now" figure (18 million) as lower than the "Before" figure (20 million).

Text in image: Hormuz Oil Volumes are BACK! Iran STRAIT OF HORMUZ United Arab Emirates Oman Before 20 Million barrels per day Now 18 Million barrels per day

Described automatically. The words above are a machine's reading of the picture, not Trump's.
Post from Truth Social

Image attachment
What the image shows chart

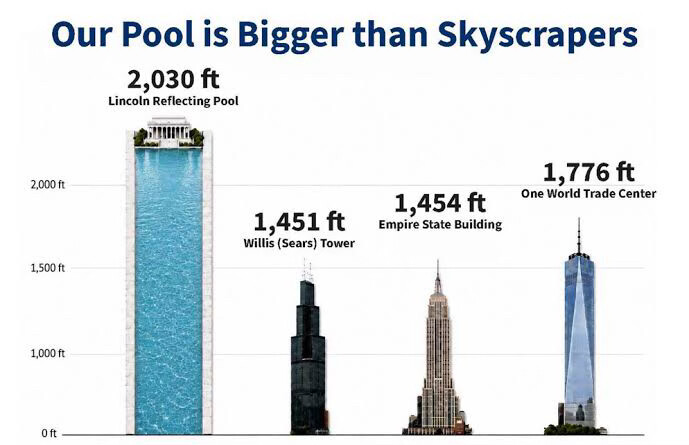
This is a bar chart / infographic comparing the length of the Lincoln Memorial Reflecting Pool in Washington, D.C. to the heights of three famous American skyscrapers. A tall blue bar shaped like the reflecting pool (topped with an illustration of the Lincoln Memorial) is shown at 2,030 ft, dwarfing illustrated bars/silhouettes of the Willis (Sears) Tower at 1,451 ft, the Empire State Building at 1,454 ft, and One World Trade Center at 1,776 ft. A y-axis on the left is marked in 500 ft increments from 0 to 2,000 ft.

Text in image: Our Pool is Bigger than Skyscrapers 2,030 ft Lincoln Reflecting Pool 2,000 ft 1,451 ft Willis (Sears) Tower 1,454 ft Empire State Building 1,776 ft One World Trade Center 1,500 ft 1,000 ft 0 ft

Described automatically. The words above are a machine's reading of the picture, not Trump's.
Post from Truth Social

Image attachment
What the image shows chart

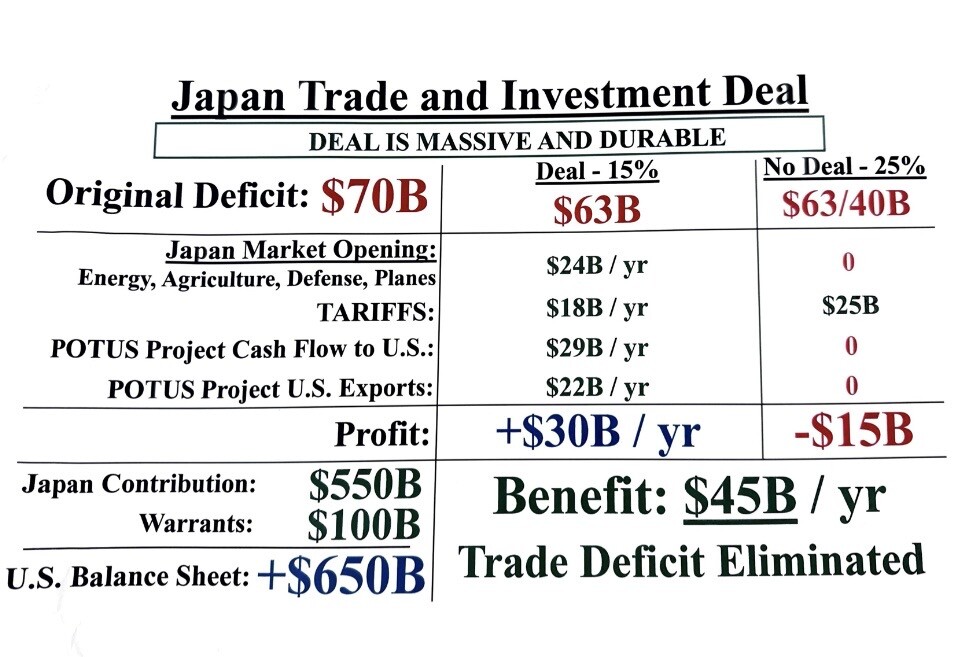
This is a text-based infographic/chart comparing scenarios for a "Japan Trade and Investment Deal." It is laid out as a table with a header banner reading "DEAL IS MASSIVE AND DURABLE," comparing an "Original Deficit" of $70B against two columns: "Deal - 15%" and "No Deal - 25%." Under Deal, it lists resulting deficit of $63B, with line items for Japan Market Opening (Energy, Agriculture, Defense, Planes) at $24B/yr, Tariffs at $18B/yr, "POTUS Project Cash Flow to U.S." at $29B/yr, and "POTUS Project U.S. Exports" at $22B/yr, totaling a Profit of +$30B/yr. Under No Deal, the deficit shows $63/40B, with $0 for market opening, $25B in tariffs, $0 for the POTUS project lines, resulting in a Profit of -$15B. Below the table, additional figures list Japan Contribution of $550B, Warrants of $100B, and a U.S. Balance Sheet total of +$650B, followed by a large "Benefit: $45B / yr" and "Trade Deficit Eliminated" statement.

Text in image: Japan Trade and Investment Deal DEAL IS MASSIVE AND DURABLE Original Deficit: $70B Deal - 15% $63B No Deal - 25% $63/40B Japan Market Opening: Energy, Agriculture, Defense, Planes $24B / yr 0 TARIFFS: $18B / yr $25B POTUS Project Cash Flow to U.S.: $29B / yr 0 POTUS Project U.S. Exports: $22B / yr 0 Profit: +$30B / yr -$15B Japan Contribution: $550B Warrants: $100B U.S. Balance Sheet: +$650B Benefit: $45B / yr Trade Deficit Eliminated

Described automatically. The words above are a machine's reading of the picture, not Trump's.